FlyRank ML Internship 2026 · Applied Search Intelligence
Which visible pages under-capture clicks — and can a simple score find them?
This paper works the CTR / Engagement Opportunity Scoring lane of the FlyRank
ML Internship: which visible pages under-capture clicks and deserve a metadata, content or
monitoring review? FlyRank's own content platform answers that with a transparent flag —
low_ctr_visible_page, which fires when a page has at least 500 impressions, ranks
between positions 1 and 20, and has a click-through rate below 0.5% — and that flag turns out to
fire on 81.2% of the pages it evaluates, because every position tier's median CTR in this data
already sits below its cutoff. Using 78.8 million daily rows of pseudonymized search-performance
data, I
built a cohort of 42,648 pages across 24 clients with a 89-day feature window and a strictly
later 31-day outcome window, and defined a page as under-capturing when its CTR falls below the
median of pages at the same position in the same month. A three-line score — the click
shortfall against those position peers, weighted by impressions — was compared against logistic
regression, a decision tree, a random forest and gradient boosting on ten client-grouped folds.
Three of the four models scored below the rule and the fourth was not statistically
distinguishable from it (+0.020 Precision@50, Wilcoxon p = 0.125), so the transparent rule is what
ships; the models did establish that the CTR-versus-position structure carries information page
size alone does not (+0.056 against an impressions-only ranking, winning all ten folds,
p = 0.002). The output is an 87-page review queue whose rows carry their own caveats, together
with a disclosed defect in my own label — 80.3% of apparent "recoveries" are pages that fell into
a weaker position band — that, once removed, flips the model's small edge into a small deficit.
1 · Introduction
The FlyRank problem this comes from
FlyRank's platform scans a client's whole content library and sorts every page into an action type — content refresh, CTR fix, quick win, engagement fix, lifecycle decision. This paper takes one of those decisions, the CTR fix, and asks whether the rule behind it can be improved.
The concrete scenario: a content reviewer working across client sites can open roughly fifty pages a week. The addressable pool here is 18,662. At that rate one pass takes seven years — so the only decision that matters is which fifty, and the only useful output is an ordering.
The flag, and why it does not order anything
FlyRank's transparent rule for this is low_ctr_visible_page: flag a page when it has
at least 500 impressions, ranks between positions 1 and 20, and has a click-through rate below
0.5%. It is the kind of rule a team can read and argue with, which is exactly what a baseline
should be — and it is the right instinct, because a page that is already visible but not clicked is
genuinely a different problem from a page nobody sees.
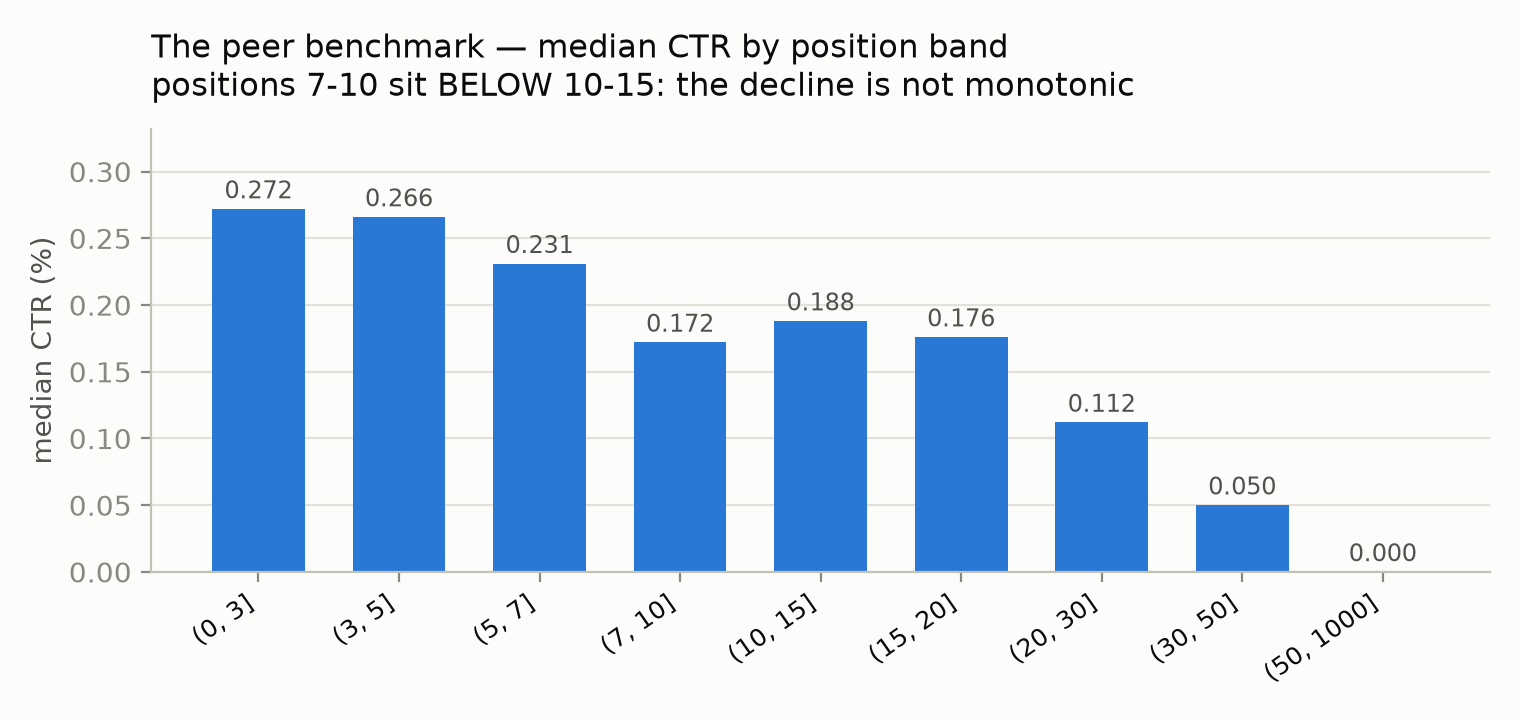
The threshold is the part that fails. Applied to the pages it evaluates, the flag fires on 81.2% of them. The reason is arithmetic rather than judgement: every position tier's median CTR in this data sits between 0.155% and 0.240%, so a fixed 0.5% cutoff sits above the typical page at every position it covers. Its engagement counterpart, which flags pages with an engagement rate below 30, fires on 100% of eligible pages.
A list containing four of every five candidates is not a priority list. This paper asks whether comparing a page to what pages at its own position actually earn does better — and whether a model does better still.
What this says back to the flag
Two things, and the first is a defence rather than a criticism. The assumption underneath the flag holds. Pages ranking in the top 10 that under-capture really are the more persistent population — their shortfall is still there a month later at a rate of 0.698, against 0.589 for pages beyond position 20. The flag is aimed at the right pages; the trigger simply cannot rank them.
The fix is to replace the constant, not the concept. Swapping the fixed 0.5% cutoff for the median CTR of the page's own position band turns a filter that fires on four fifths of the library into an ordering. And one further refinement the flag cannot make from a single window: among those top-10 under-capturers, the pages that held their ranking between windows are the more persistent group still — a page whose position is stable and whose clicks are short has a problem in the result itself, while a page that fell has a ranking problem no snippet rewrite will reach.
2 · Data
The FlyRank/internship-warehouse release
(flyrank_pseudonymized_warehouse_release_v20260703): 78,835,655 daily
rows across 104 pseudonymized clients and 519,606 content items, plus a 30,000-row anonymized
starter slice. Tables used: dim_clients, dim_content, and
fact_content_daily_performance.
Windows
 2026-02-01              2026-04-30 │ 2026-05-01    2026-05-31 │ 2026-06-01   2026-06-30
 ├──── FEATURE WINDOW ─────────────┤ ├─── TARGET WINDOW ──────┤ ├──── SEALED ────────────┤
   89 days. Everything usable.         31 days. The outcome.      Never opened.
Nothing dated 2026-05-01 or later enters a feature. The June partition was never read — not during development, and not to check whether a conclusion survived. Opening it would have turned it into a development set.
From 519,606 content items to 42,648 rows
| Step | Remaining |
|---|---|
Content items in dim_content | 519,606 |
| Drop deleted and unpublished | — |
| Drop pages optimized during the outcome window | −17,099 |
| Keep clients whose search history reaches 2026-02-01 | 41 of 104 clients |
| Require ≥300 impressions in both windows | 42,648 rows · 24 clients |
What was excluded, and why
| Excluded | Reason |
|---|---|
fact_content_query_90d — the whole table | Its window is fixed at 2026-04-02 → 2026-06-30, which spans the outcome month completely. Query-mix features cannot be decision-time inputs under this design, so the table was forfeited rather than used carelessly. |
| Engagement / analytics columns | Only 10 of 104 clients have analytics history covering the feature window. The scope was narrowed to CTR-only rather than reporting engagement on a tenth of the panel. |
| Pages optimized inside the outcome window (17,099) | A human edit during the outcome window means the outcome no longer measures what the page was doing on its own. |
| Staleness as a signal | Measured and rejected — see Methodology. |
| Product decision flags | Not shipped in the release at all, deliberately, so discovery cannot become circular. |
Every identifier is a pseudonymous hash. No client name, domain, URL, page title or raw search query appears in this paper, in the notebooks, or in any exported file.
3 · Methodology
The label, and why it has two windows
under_capturing(window) := ctr(window) < median ctr of the same position band, in that window
label                   := under_capturing(feature window) AND under_capturing(outcome window)
The "and still" clause is the whole point. 33.4% of pages under-capturing in the feature window are no longer below their peer median a month later, with nobody touching them. A queue built on a single snapshot spends a third of its slots on pages that resolve on their own.
The benchmark is recomputed inside each window. That matters more than it sounds: 82.8% of pages ranked worse in the outcome window than in the feature window, the median falling 2.89 places, with 19 of 24 clients sliding the same way. Against a single blended position, most of that market-wide slide would have been read as a change in CTR.
A signal I measured and threw away
Staleness was going to be half the rule. On the starter slice
days_since_last_update has 57 distinct values across 30,000 pages, a median of
3 per client, and one client puts 82.9% of its 1,796 pages on a
single value. It records content-management batch jobs, not per-page staleness. The consequence
for the rule built on it is stark: days_since_last_update ≥ 180 combined with an
impressions floor fires on 17 of 30,000 rows. On the warehouse cohort only 46 of
42,648 pages have a usable optimization date at the decision point, carrying one value from one
client. Checking it first is what stopped a queue ordered by a client-level timestamp from
shipping as "content freshness".
The signal that survived
The baseline
score = (impressions ≥ 1000) × max(0, peer_median_ctr − ctr) / 100 × impressionsThree lines, one reason code, and a unit a reviewer can argue with: clicks the page did not earn. A per-client cap of five is applied when building the queue — it held Precision@50 unchanged while lifting client coverage from 6 to 14.
Validation
Ten repeats of a grouped holdout on client_hash_id, 25% of clients held out each
time, with the baseline and every model scored on the same folds and compared pairwise.
Grouped, because pages inside one client share a domain, a template and a house style. Repeated,
because earlier in this project a single split produced a conclusion that ten splits reversed.
Leakage checks
| Check | Result |
|---|---|
| All features strictly before the outcome window | asserted in code |
| Label-derived sibling — train-without test | dropped it; Precision@50 unchanged at 0.952 |
| Product decision flags as features | none present in the release |
| No client on both sides of a fold | asserted per fold |
| Harness test — inject a known leak | injecting an outcome-window column moves AUC decisively; the detector fires |
| Base rate reported beside every metric | 0.670, not the cohort's 0.325 |
| Population selection uses outcome-window information | yes — disclosed in Limitations |
That base rate deserves its own sentence. The score is zero unless a page already under-captures, so the rule can only pick from 18,662 eligible rows, of which 67.0% carry the label. Quoting Precision@50 against the cohort's 0.325 would report a 2.9× lift where the real one is 1.43×.
4 · Results
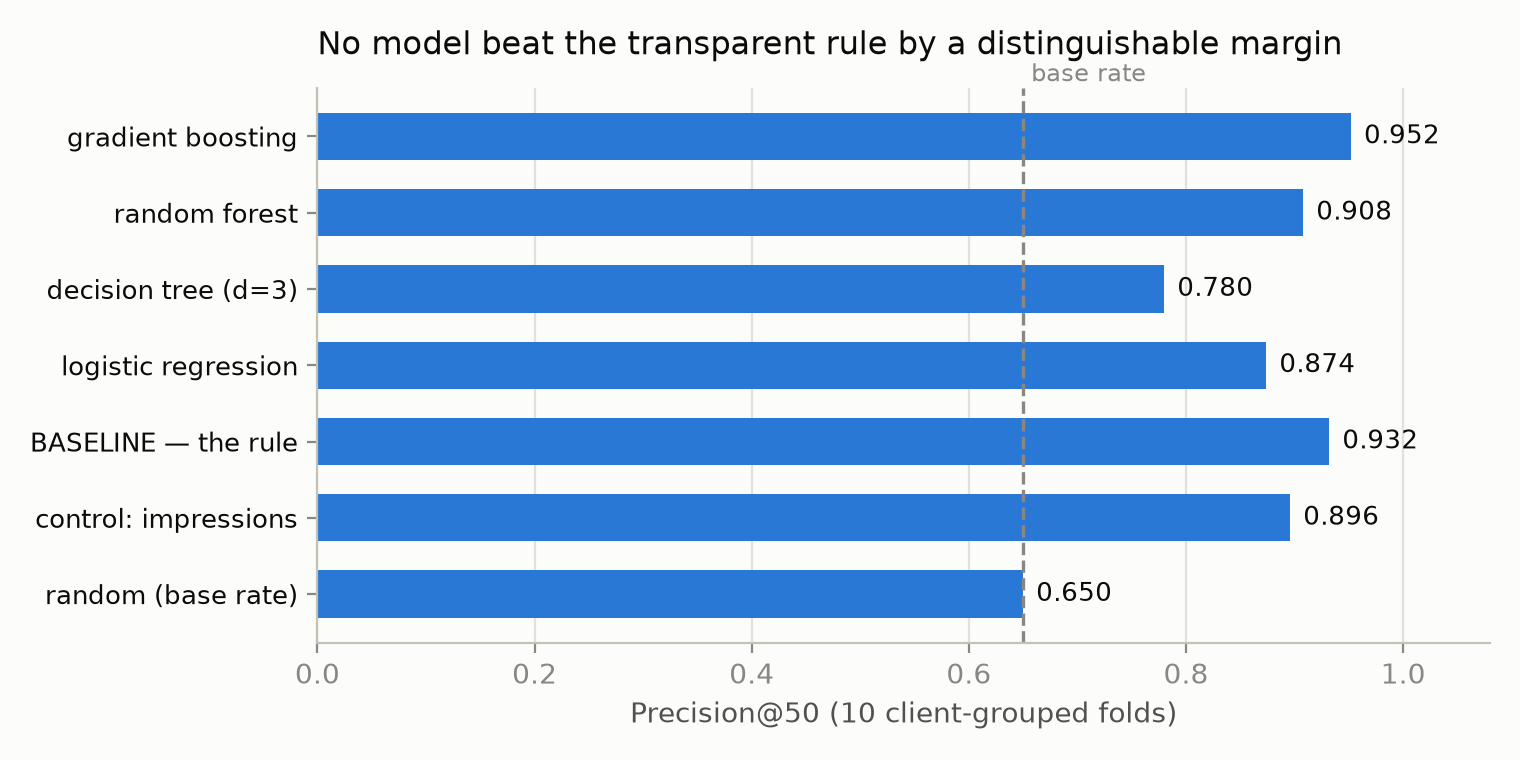
| Method | Precision@50 | std | vs the rule |
|---|---|---|---|
| Random (base rate) | 0.650 | 0.067 | — |
| Control: impressions alone | 0.896 | 0.031 | control |
| Baseline — the transparent rule | 0.932 | 0.044 | the bar |
| Logistic regression | 0.874 | 0.073 | loses |
| Decision tree (depth 3) | 0.780 | 0.157 | loses |
| Random forest | 0.908 | 0.124 | loses |
| Gradient boosting | 0.952 | 0.037 | +0.020, p = 0.125 |
The headline is a tie, not a win
Paired fold by fold, gradient boosting is +0.020 over the rule: five wins, two losses, three ties, Wilcoxon p = 0.125. That is not significance at any conventional threshold, so the honest sentence is "not distinguishable from the rule" — and the transparent three-line score is what ships. Reporting +0.020 as an improvement would be the same error as trusting a single split.
What the models did settle
Against ranking by page size alone, gradient boosting is +0.056 and wins all ten folds (p = 0.002). That closes a real question: the rule's 0.932 sat close enough to the impressions control's 0.896 that its CTR reasoning might have been decoration. It is not — the CTR-versus-position structure carries information page size does not. Removing the label-sibling feature leaves Precision@50 unchanged at 0.952, so the model is reconstructing that signal rather than echoing the baseline's own score.
The split mattered more than the model
| Split | Precision@50 | ROC-AUC |
|---|---|---|
| Random rows | 0.990 | 0.703 |
| Grouped by client | 0.952 | 0.619 |
| Gap | −0.038 | −0.085 |
A random split reports Precision@50 of 0.990 — near-perfect and meaningless. 0.085 of AUC was memorising the client, not reading the page.
What the model leans on
Permutation importance on held-out clients puts the shortfall at 0.0516, impressions at 0.0346, position at 0.0292 and CTR at 0.0106 — while every content-metadata column combined contributes about 0.002. Word count, backlinks, search volume, intent and competition carry almost no information about whether a shortfall persists. On this cohort, how a page performs in search predicts its shortfall; what the page is does not.
5 · Limitations
The defect I found in my own label
The label can be satisfied by a page falling. One page under-capturing at position 5.9 appears a month later at position 51.7, where the peer group's median CTR is 0.000% — and clears it. It did not recover; it escaped its benchmark. Across the cohort, 5,586 of 6,956 "recoveries" (80.3%) moved into a weaker position band, and in 251 cases (3.6%) the page's CTR actually fell while still counting as recovered. The flagrant share is 3.6%, not 80% — most band-movers did improve CTR in absolute terms — but the bias has a direction, so the 33.4% self-heal figure is an upper bound, not an estimate. Re-running on the subset of pages that stayed in their band flips the model-versus-rule difference from +0.020 to −0.030 (one win in ten folds, p = 0.062). The conclusion that the rule stands survives; the reasoning behind it was weaker than it looked.
The rest
| Limitation | Consequence |
|---|---|
| Survivorship in the population | A page enters only with ≥300 impressions in both windows — and the second is the outcome window. Pages that collapsed to nothing are absent entirely, so every result describes survivors. The floor stays because without it the label is computed on a handful of impressions, where one click moves CTR by whole percentage points. |
| 24 clients, one 3-month window | Selected for long history and high traffic. Nothing here transfers automatically to a small or newly-tracked client. |
| No "why" | No search-feature history, no AI-overview presence, no algorithm-update log, no competitor data. A weak title and a search feature occupying the space above the result are indistinguishable in this data. |
| No causation | No experiment, no treatment and control. This cannot show that an edit produces recovery. |
| A declining period | 82.8% of pages ranked worse in the outcome window. The benchmark is calibrated on a sliding market, so a model fitted here may be fitting the period. |
| One month of outcome | A page stuck for a year and a page in a two-month dip produce the same row. |
On 24 clients over one three-month window, a transparent position-adjusted score ordered a review queue better than page size did (Precision@50 0.932 against 0.896 on client-grouped folds); no model tested improved on it by a distinguishable margin; and content metadata carried almost no information about whether a click shortfall persists.
That editing any page causes recovery. That the pattern holds outside these clients or this window. That a low click-through rate identifies a snippet problem. That "recoverable clicks" is a forecast rather than an arithmetic ceiling.
6 · Ranked recommendations
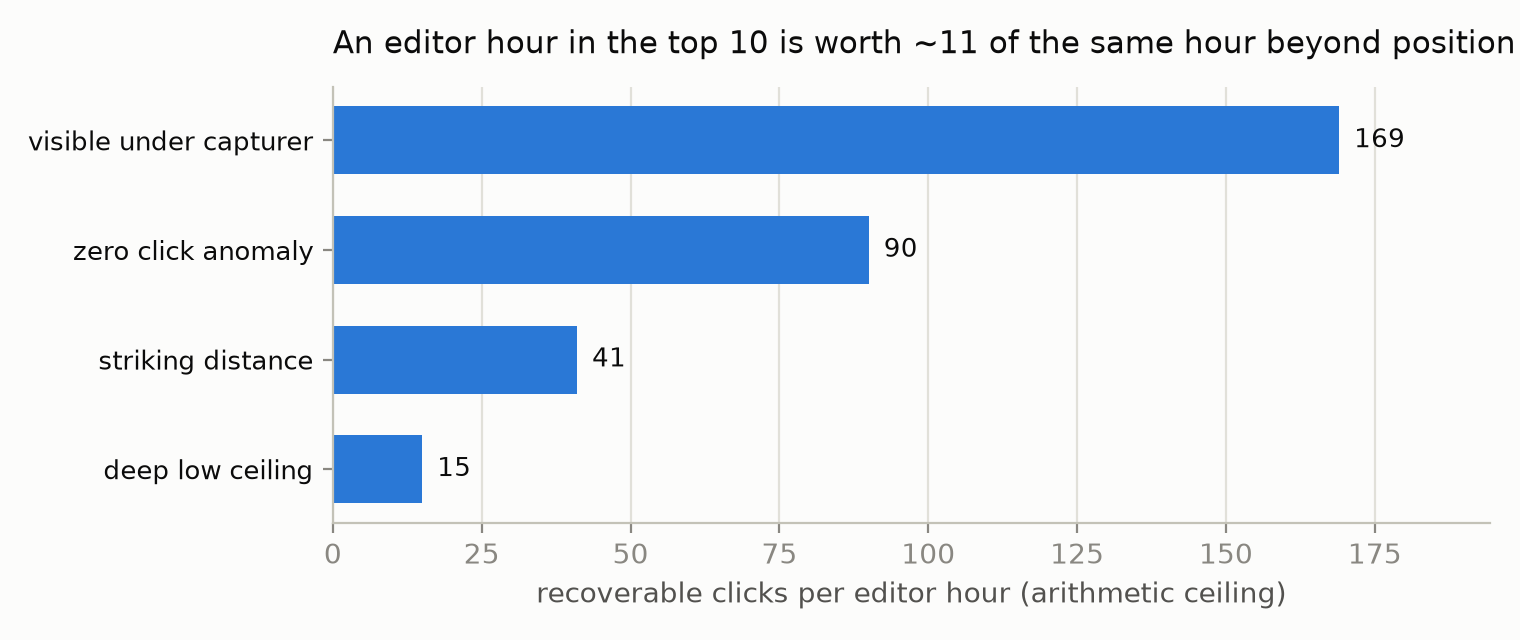
The output is an 87-page review queue across 20 clients, drawn from 18,662 candidates at five per client. Every row carries an archetype, an action, a reason code, and its own caveats as data columns.
| Archetype | Action | Clicks / hour | Persists |
|---|---|---|---|
| Visible under-capturer (rank ≤ 10) | Review title & meta description | 169 | 0.697 |
| Zero-click anomaly | Verify tracking — do not edit | 90 | 0.706 |
| Striking distance (11–20) | Review intent match & depth | 41 | 0.607 |
| Deep, low ceiling (> 20) | Monitor | 15 | 0.574 |
The recommendation that survives changing the assumptions
The editor-hour rates behind that chart are estimates, so the ordering was re-run under alternatives. The top is not stable: double the cost of a title rewrite and the zero-click archetype takes first place, because a tracking check is cheap. The bottom is — deep pages rank last under every variant tried. So the defensible recommendation is the negative one:
Pages ranking beyond position 20 are the worst use of an editor hour, under every cost assumption tested — roughly 15 recoverable clicks per hour against 169 at the top of the results.
Three practical rules
- Work the top of the results, not the biggest raw shortfall. Persistence falls with depth (0.697 → 0.574), and so does value per hour.
- Pages that held their position are the cleanest candidates. Among under-capturing pages, those that kept their ranking persist more (0.731) than those that fell (0.659) — a stable ranking with a persistent shortfall is a problem in the result itself, while a falling page's problem is its ranking, which a rewrite does not address.
- Treat zero-click rows as a measurement question first. Real impressions and exactly zero clicks over three months is more consistent with an attribution gap than with a weak title.
Never automated
Publishing a rewrite · deleting, merging or redirecting a page · acting on a zero-click row · scoring a client with fewer than 50 pages in the cohort · scoring any client outside the validated 20 · reporting recoverable clicks as a forecast. If a reviewer rejects three consecutive rows as "not actually a snippet problem", the queue stops and the benchmark is audited.
Monitoring
There is nothing to retrain — the scorer is a median lookup. What goes stale is the benchmark, and seven triggers watch it: benchmark drift beyond 25%, client coverage below 10, base rate outside 0.60–0.75, three consecutive rejections, the label-artifact share rising above 85%, the market direction reversing, and the zero-click share exceeding 15%. Cadence is monthly, because the outcome window is a month; a weekly rebuild would be measuring noise.
7 · Reproducibility
Every number on this page is produced by a notebook in the repository, executed top to bottom with outputs committed. Seeds are fixed at 42 and library versions are printed in each run.
| Stage | Notebook |
|---|---|
| Research question and lane | work/notebooks/w01_research_question.ipynb |
| ML task framing and the two-window target | work/notebooks/w02_ml_task_framing.ipynb |
| Data contract, windows, cohort build | work/notebooks/w03_data_contract.ipynb |
| Signal checks and the baseline | work/notebooks/w04_baseline_score.ipynb |
| Modelling and error analysis | work/notebooks/w05_model.ipynb |
| Validation and claim audit | work/notebooks/w06_validation_audit.ipynb |
| Action playbook and exports | work/notebooks/w07_action_playbook.ipynb |
| This paper, end to end | work/notebooks/capstone.ipynb |
Metrics files under work/outputs/*.json are the receipts every number here traces
back to. Dataset files are deliberately excluded from version control — the notebooks regenerate
them, and continuous integration fails the build if a data file is ever committed.
Repository: github.com/Ovais-Maker/flyrank-ml-internship
8 · Acknowledgments & data credit
Built on the FlyRank ML Internship dataset — https://flyrank.ai
This work uses the pseudonymized FlyRank/internship-warehouse release published for
the FlyRank ML Internship 2026. All identifiers were pseudonymized before release; no client names,
domains, URLs, page titles or raw search queries were available to this work or appear in it.
Thanks to the FlyRank team for publishing a dataset at genuine production scale, and for the
internship structure that required a baseline before a model and an audit after one — the sequence
that produced this paper's main result.